Insert Selective Coordination Graph
The
To insert a selective coordination graph, go to
Ribbon: ![]() Insert Selective Coordination Graph
Insert Selective Coordination Graph
Pulldown Menu:
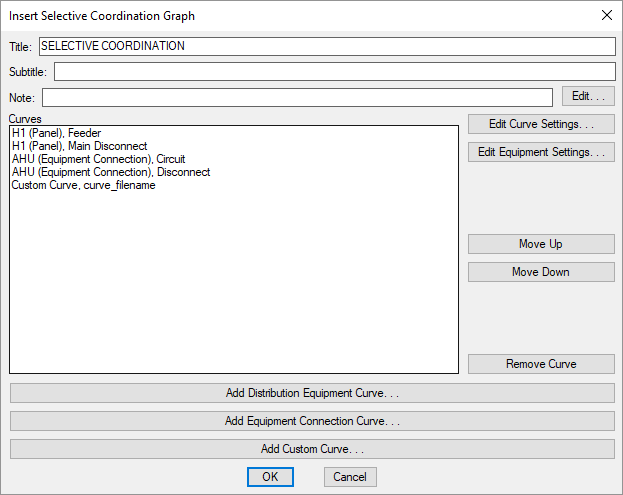
Insert Selective Coordination Graph Dialog Box
-
Title: The title to be used for the graph.
-
Subtitle: A subtitle to be added below the title for the graph.
-
Note: A note that will appear below the graph when it is inserted on the drawing.
-
Curves ☰ A list of the curves to be displayed in the graph.
-
Press this button to edit the selected curve.
For distribution equipment and equipment connection curves, the Select Curve dialog box will open.
For custom curves, the Add Custom Curve dialog box will open.
-
Press this button to open the Distribution Equipment Dialog Box for the selected distribution equipment, or the Edit Equipment dialog box for the selected equipment connection.
-
Press this button to move the selected row up in the list of curves.
-
Press this button to move the selected row down in the list of curves.
-
Press this button to remove the selected row from the list of curves.
-
Press this button to add a distribution equipment curve to the list of curves.
If the selected distribution equipment has curves defined for the feeder and main disconnect, you will be asked to specify which curve to add.

-
Press this button to add an equipment connection curve to the list of curves.
If the selected equipment connection has curves defined for the circuit and equipment disconnect, you will be asked to specify which curve to add.

Adding a Custom Curve
Press the button to add a custom curve to the list of curves. The Add Custom Curve dialog box will open.

-
Label: The label that will correspond to the curve when the graph is inserted on the drawing.
-
Curve File: The DBC file where the custom curve is stored.
-
Select Curve File: Press this button to select a custom curve file. The Select Curve File dialog box will open.
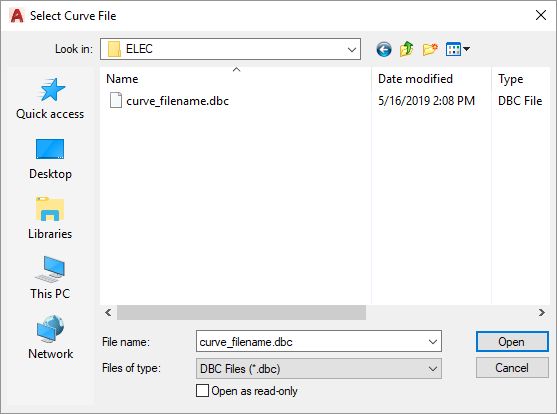
Select the curve file to be used and press the button. The file name and path will be displayed in the Curve File field.
-
Press this button to create a custom curve file by tracing a time-current curve from another source, such as a PDF. The Save Curve File As dialog box will open.
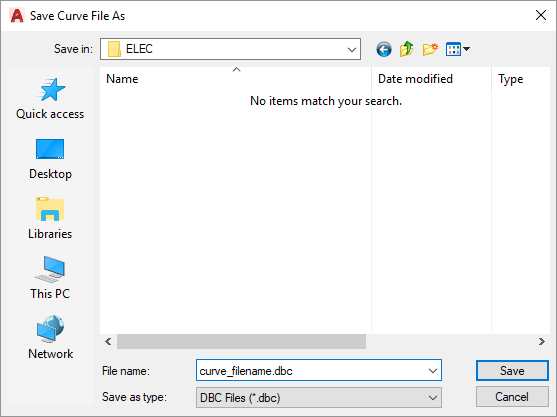
Enter a name and location for the DBC file, then press the button. You will then be prompted to enter a label for the curve.
After you have entered a label for the curve, you will be prompted to enter an amp value that appears on the graph you want to trace, then specify a point on the graph at that amp value along the x-axis.
Enter first current value in amps:Specify location of <Value> amps:After you have specified the point, you will then be prompted to enter a second amp value and specify a point on the graph.
Enter second current value in amps:Specify location of <Value> amps:After you have specified the point, you will then be prompted to specify points on the graph at the 1-second value and 10-second value on the y-axis.
Specify location of 1 second:Specify location of 10 seconds:After you have specified the points, you will then be prompted to specify the first point on the curve.
Specify first point on curve:Select a point at one end of the curve you want to trace. You will then be prompted to select additional points on the curve.
Specify next point on curve:Continue tracing the curve, then press ENTER when you are finished. You will then be prompted to trace a second curve.
Specify first point on second curve / <Enter for no second curve>:-
Specify first point:Select a point at one end of the second curve. You will be prompted to select additional points on the curve.
Specify next point on second curve:
Continue tracing the second curve. Press ENTER to finish the command and return to the Add Custom Curve dialog box. The curve will be displayed as a range with hatching between the two curves you traced. -
No second curve:Press ENTER to finish the command and return to the Add Custom Curve dialog box. The curve will be displayed as a single line.
-
Inserting the Selective Coordination Graph on the Drawing
To insert the selective coordination graph on the drawing, press the button. The settings you specified in the dialog box will be used for the graph you insert.
You will be prompted for the insertion location of the graph.
Specify insertion point of selective coordination graph:
The location you specify will be used as the top-left corner for the graph.
Selective coordination graph title: Sets the default text for the Title field.